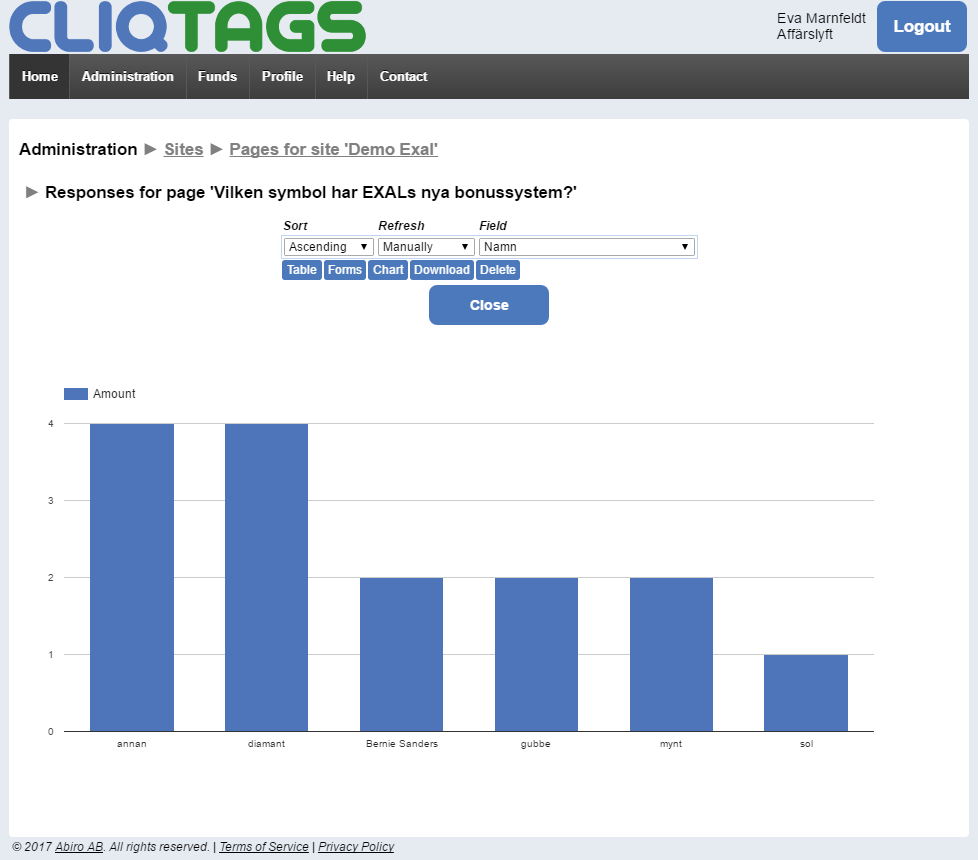
On the Responses page in the Admin Portal you can now choose a field to see results for. This is very useful for e.g. surveys and polls.
You select a survey form to show responses for, select what field should be charted, and click on Chart.
The setting with the most selections are shown to the left and so on. The 20 most selected values are shown. You can download a CSV file in this mode as well, and then you get all the values for the field (no limit at 20), in popularity order.
You can use this in combination with Refresh – Automatic to see results as they are collected.
Any field type can be charted, but it’s naturally most relevant for fields with a fixed number of options.